
The Proof is in The Payment
We all know this saying: “The proof is in the pudding“. Unfortunately, there will be no pudding if you count your chickens before they hatch.
That is what most companies do. We get excited when we get many new leads. Some even ring a bell when they make a sale.
We should sound an alarm: “TOO SOON... ”
We calculate the cost of acquisition of the new customer as soon as the sale is made.
We know what the conversion rate is from leads to sales.
“We made 150 sales from just 1000 leads giving us a 15% conversion rate. ”
YOU ARE CELEBRATING TOO SOON…
Do you know what your conversion rate is of payments received versus leads received?
What is very important to understand and to track, is the drop-off rate or conversion rate at every step of the process. From Views to Leads, Leads to Sales, Sales to Installations/Deliveries, Installations/Deliveries to Invoicing, Invoicing to Receipts.
At every step in the process there is a potential drop-off that has a direct impact on the actual cost of acquisition or cost of sale.
We have seen many companies making losses or not being able to grow their businesses because they don’t have a realistic picture of their actual costs. Added to that, they also don’t know what their selling price should be.
The best companies understand the drop off rate or conversion rate at each step. They therefore plan for it in their financial projections.
A recent example that we encountered:
A company was able to get very good leads, had great sales people and an excellent sales manager. They therefore made a large amount of sales at a conversion rate of 25% to 30%. They were however not ready for the large volumes of installations that had to take place. They started out with installing only 40% to 50% of the sales.
Adding to that, the billing and debit order collection process was a manual process which meant many errors, such as not having a complete list of all customers to be billed, incorrect banking details, debit dates or amounts.
This meant that they were only able to collect from 50% of the customers where installations were completed.
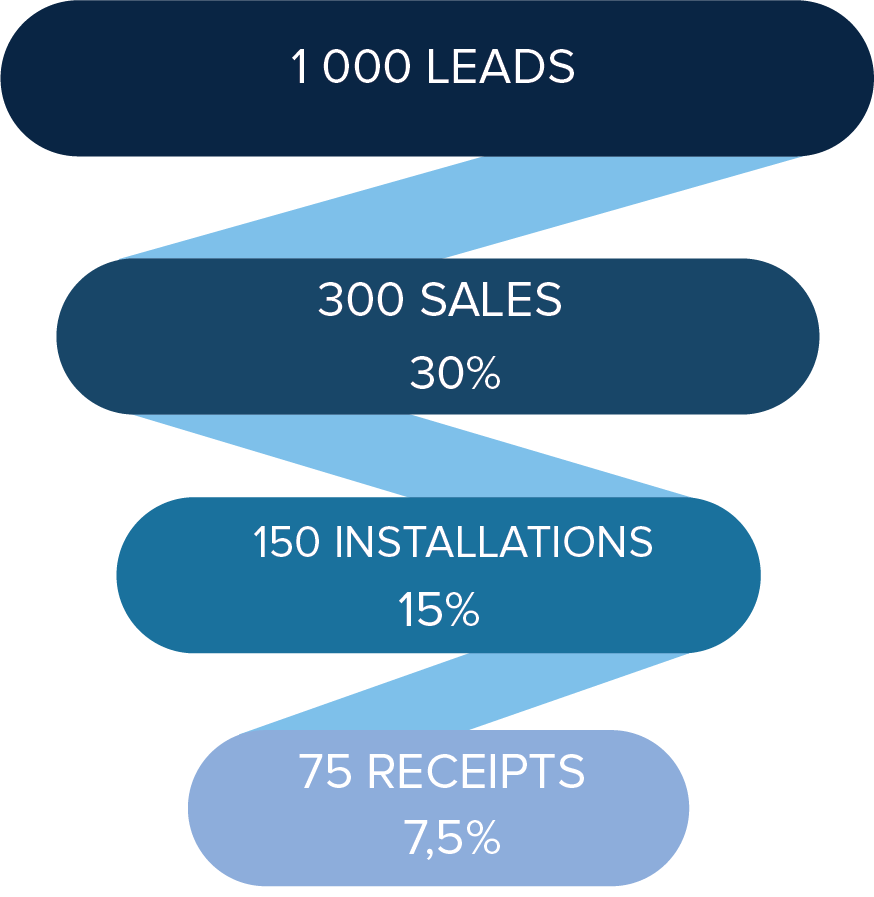
In summary, what looked like a 25% to 30% conversion rate for sales made, turned out to be a 7.5% conversion rate from money in the bank compared to leads received.
Just to put this in context,
1.If they paid for 1 000 leads at R100 per lead that is R100 000. If you divide the R100 000 by the 300 (30%) sales they made, their lead cost per sale would have been R333,33.
2. Of the 300 sales however only 150 were installed. If you now take the R100,000 paid for leads and divide it by the 150 installed units, the cost per sale is now R666.67.
3. Further to this, of the 150 installations only 75 was actually paid for. To get to the final cost per sale you take the R100 000 lead cost and divide it by the 75 payments received to get to R1 333,00.
4. In conclusion, if they planned for a cost per sale of R333 or even R500, it ended up being R1 333 per sale, this would severely impact their profitability.
The proof of the sale is in the payment received.
Money in the bank is the only validation that a sale was made. The good news is that since we were able help this company by automating and tracking every step of the process, they are still selling at between 25% to 30 % but they now install at 90% and billing and collect their money at 90% giving them a real conversion rate of between 20% or 24% which is very remarkable.
If this resonates with you, connect with us so that we can help you too.